

Clipboard Health
Data Analysis and Findings of a two sided marketplace
Problem Statement
Clipboard health is a two sided marketplace with strong network effects where workers transact with workplaces to book per diem shifts in the future. Workplaces post shifts and workers choose which shifts they’d like to work by booking them.
When workers shop for shifts to work on our mobile app, they see the location of the shift, the duration of the shift, and the pay rate we’re offering for the shift (along with some other information). We call this group of data a shift offer [see right]. Workers then decide whether or not they’d like to work the shift, and they do so by booking it. Workers can then cancel their booking, or a healthcare facility can determine they no longer have a staffing need and delete the shift. We’ve compiled a list of shift offers for you. Every shift offer in our list was viewed by the worker listed.
Workplaces post shifts onto our app. Every shift they post has a unique shift id. We charge workplaces a flat rate per hour. We pay workers a portion of the charge, and take the rest as revenue.
Please note that each row in the table represents a shift offer. A single shift, on the other hand, might have many offers going to many different workers.
When workers view shifts, our backend generates a "shift offer", i.e. a rate we're offering the worker at a specific moment in time. This abstraction means that every row in the data table represents a view, rather than a shift.
You can think about every row as a view with a specific pay rate we're offering to a specific worker. That offer is either claimed or not claimed. It can then be subsequently canceled, no showed, or worked.
label | type | definition |
shift_id | string | Unique identifier for a shift. |
worker_id | string | Unique identifier for a worker. |
workplace_id | string | Unique identifier for a workplace. |
shift_start_at | isodate | Time shift starts (UTC). |
shift_created_at | isodate | Time shift was posted to the marketplace (UTC). |
offer_viewed_at | isodate | Time worker viewed the shift offer (UTC). |
pay_rate | float | Hourly rate offered to worker for the shift. |
charge rate | float | Hourly charge per labor hour at a facility |
duration | float | Duration of shift in hours. |
slot | string | Timeslot of shift (NOC == overnight). |
claimed_at | isodate | Time shift was booked by worker (UTC). |
canceled_at | isodate | Time shift was canceled by worker (UTC). |
deleted_at | isodate | Time shift was deleted by workplace (UTC). |
is_ncns | boolean | Worker was a no call no show, i.e. didn’t show up for the shift and did not cancel. |
is_verified | boolean | Worker worked shift. |
Analyze the data and identify any interesting insights
1. My Findings
A. Claim Conversion & Timing
Overall Claim Rate: Only 4.91% of shift offers are claimed, revealing a major conversion gap.
Time-to-View: On average, workers view offers 74.6 hours after creation, though the median is much lower—suggesting many offers are seen quickly while some lag, potentially missing opportunities.
Time-to-Claim: When an offer is claimed, the action occurs almost instantly—typically within minutes.
B. Monetary Incentives Impact
Pay Rate Influence: Higher pay rate deciles correspond with significantly increased claim rates, implying that even modest hourly rate increases boost engagement.
Profit Margin Dynamics: An inverse relationship exists: offers with lower profit margins (i.e., where workers receive a larger share) see higher claim rates, indicating sensitivity to fair compensation.
C. Advance Notice & Shift Timing
Advance Notice: The average advance notice is about 6.4 days, but the median is below 1 day. Shifts with 0–1 day notice achieve the highest claim rates, indicating that last-minute opportunities drive quicker responses.
2. Questions and Hypotheses
Why are only 4.91% of offers claimed?
Is there a misalignment between when offers are posted and when workers are actively engaging with the platform?
Approach: Granular Time-Series Analysis:
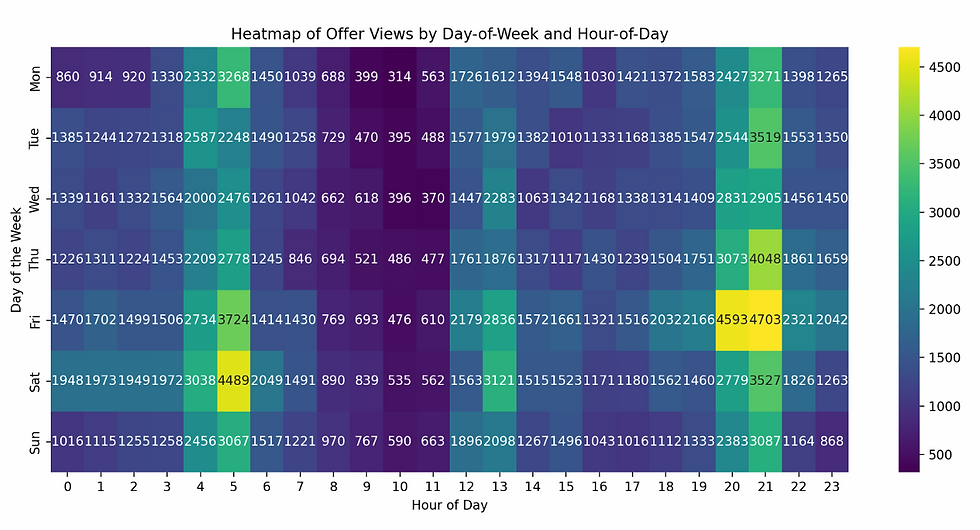
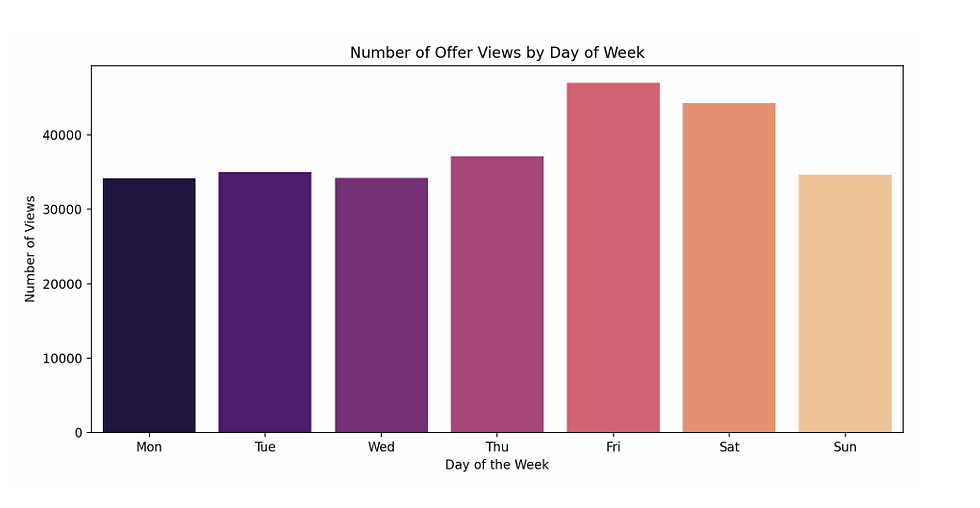
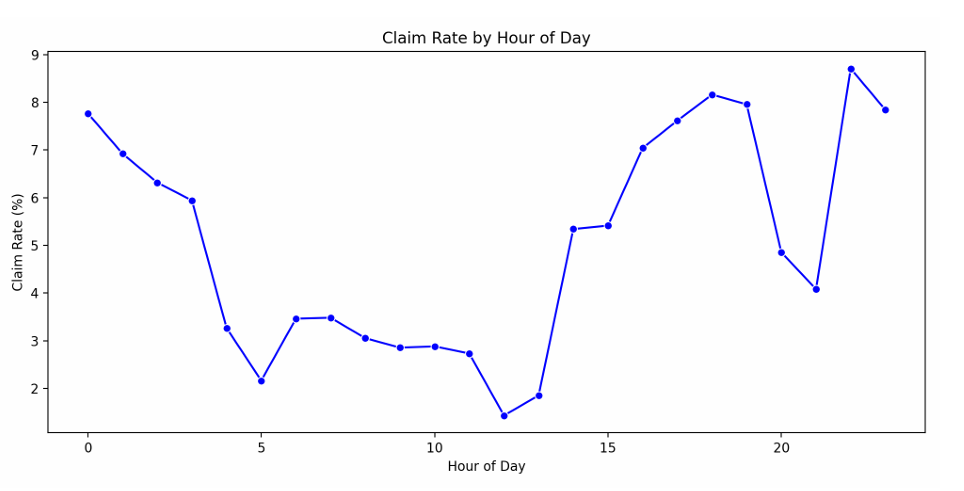
I analyzed offer views by hour-of-day and day-of-week.
Hourly Findings: Peak view counts occur during later hours (e.g., Friday at 21:00 with 4,703 views).
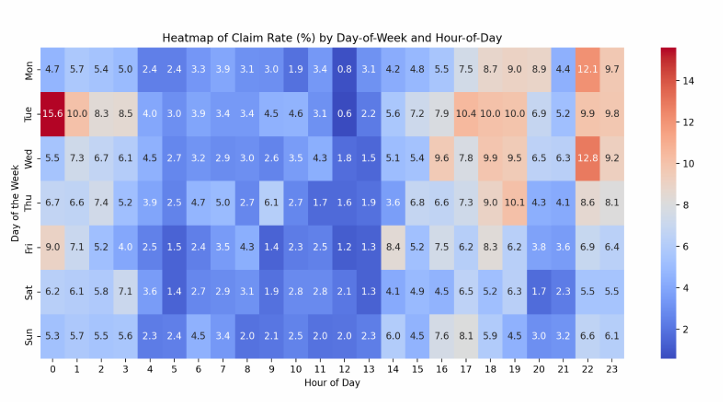
Daily Findings: Higher engagement is seen on Fridays and Saturdays, while specific periods (e.g., Tuesday at 15:00) have claim rates up to 15.6%.
These results suggest that notifications sent during these high-engagement windows might lead to better visibility and higher claim rates.

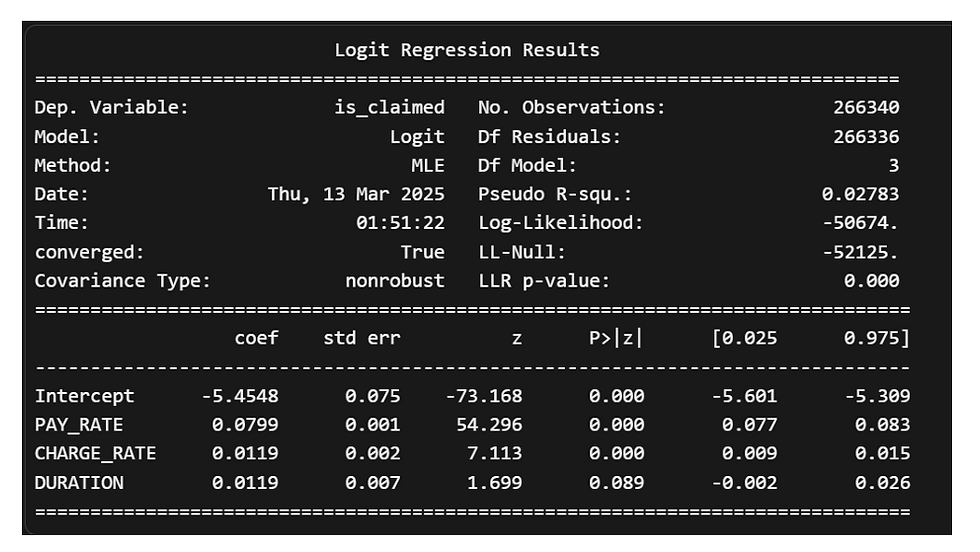
2. Can a modest increase in PAY_RATE significantly improve claim rates?
Are there diminishing returns if PAY_RATE is increased beyond a certain threshold?
Approach: Regression Analysis & What-If Simulation:
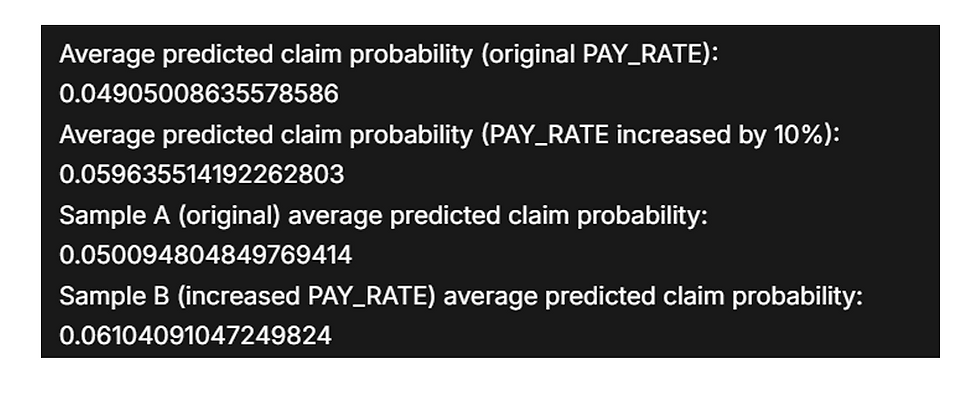
Logistic regression indicates a 10% PAY_RATE increase boosts predicted claim probability from ~4.9% to ~6.1%.
This simulation confirms that even small increases in PAY_RATE could enhance conversion.
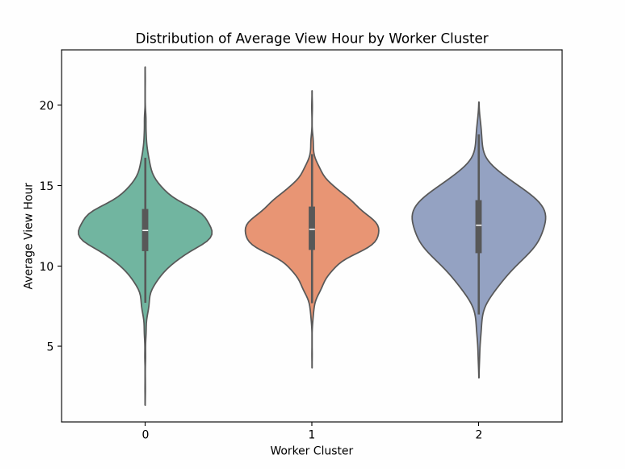
3. Do different worker segments exhibit distinct preferences regarding shift types or advance notice intervals?
How can we personalize notifications to align with each segment's behavior?
Approach: Clustering Analysis
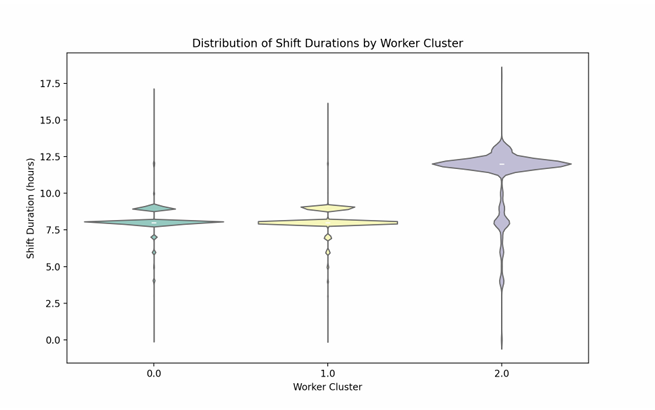
Workers were segmented into three clusters
Cluster 0: ~1.92% average claim rate.
Cluster 1: ~4.27% average claim rate.
Cluster 2: ~6.09% average claim rate, with a tendency toward longer shifts (average duration ~11.25 hours).
The most responsive group (Cluster 2) tends to work longer shifts and could be targeted with offers for higher-paying, longer-duration shifts.
Implication: Tailored strategies per cluster could improve matching efficiency.

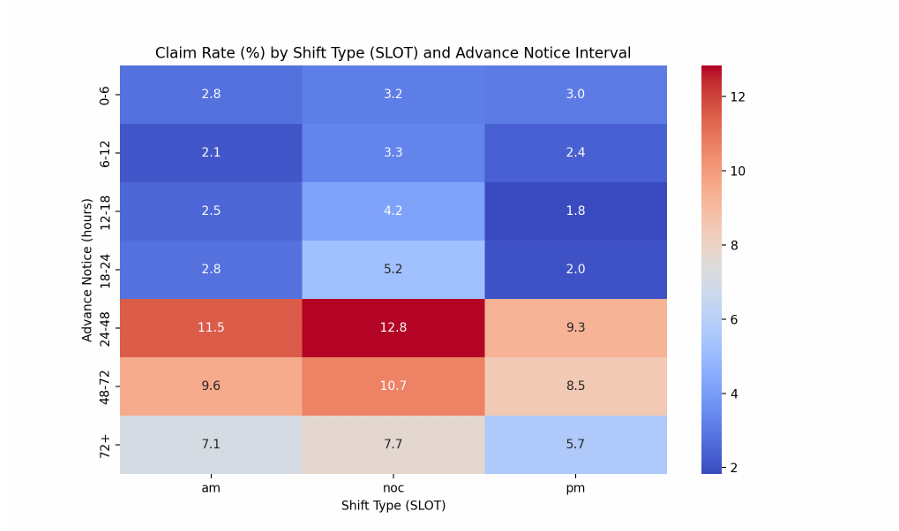
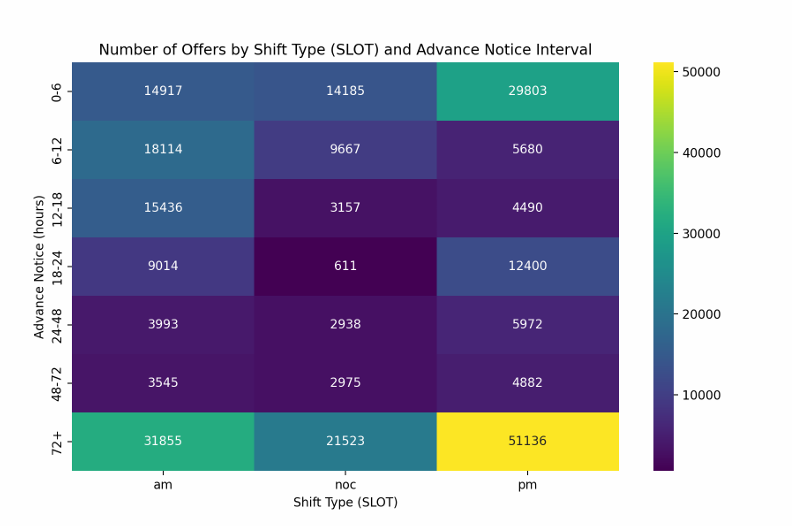
4. How do shift types and advance notice intervals interact to influence claim rates?
Is there a particular combination (e.g., am shifts with 24–48 hours notice) that maximizes claim rates?
Approach: Segmentation by SLOT and Advance Notice:
Grouping shifts by type and notice interval revealed significant variations in claim rates.
For instance, am shifts with 24–48 hours notice yield a claim rate of ~11.52%, while noc shifts in the same bracket achieve ~12.83%.
This indicates the potential for tailored matching strategies based on these variables.
Merging worker clusters with shift type and advance notice segmentation shows that: Certain worker segments (e.g., Cluster 2) respond better to longer notice intervals for specific shift types.
Others may be more attuned to last-minute opportunities.
3. Product Improvement Recommendations
A. Optimize Notification Timing
Insight:
Peak view periods on Friday evenings and higher claim rates in early morning hours (e.g., Tuesday 15:00 at 15.6%) indicate optimal engagement windows.
Action:
Develop a dynamic notification scheduler to send offers during these high-engagement periods.
Expected Outcome:
Improved offer visibility and higher claim conversion.
B. Implement Dynamic Pricing Adjustments
Insight:
Regression analysis shows a 10% increase in PAY_RATE boosts claim probability from ~4.9% to ~6.1%.
Action:
Run controlled A/B tests with a dynamic pay boost (e.g., 10% increase) on selected shift offers.
Expected Outcome:
Higher conversion rates with minimal impact on overall margins.
C. Personalize Offers Through Worker Segmentation
Insight:
Distinct worker clusters exhibit varying claim rates (1.92%, 4.27%, and 6.09%).
Action:
Use a recommendation engine to tailor shift offers based on cluster characteristics.
For instance, target Cluster 2 with longer shifts and higher pay offers.
Expected Outcome:
Enhanced matching efficiency by aligning offers with worker preferences.
D. Refine Shift Matching Based on Notice Intervals & Shift Types
Insight:
Claim rates vary significantly by shift type and advance notice interval (e.g., am shifts with 24–48 hours notice yield ~11.52%).
Action:
Adjust the presentation and pricing of shift offers based on their notice interval and type.
Highlight last-minute offers to workers who have shown responsiveness to short-notice shifts.
Expected Outcome:
Better alignment of shift offerings with worker availability and preferences, reducing unclaimed shifts.
4. Success Metrics
Overall Claim Rate:
Aim for an increase from 4.91% to a target improvement (e.g., 6% or higher).
Conversion Rate per Notification Window:
Track claim rates during the optimized notification times
Impact of Dynamic Pricing:
Measure the change in claim probability pre- and post-implementation of the PAY_RATE boost
Worker Segmentation Performance:
Analyze engagement and claim rates across worker clusters to ensure that tailored offers lead to improvements, particularly in the lower performing segments.
North Star metric:
Successful Shift Fill Rate – the percentage of shift offers that are not only claimed but also completed successfully. This metric captures the effectiveness of our matching process, drives revenue, and reflects the overall health of the marketplace.